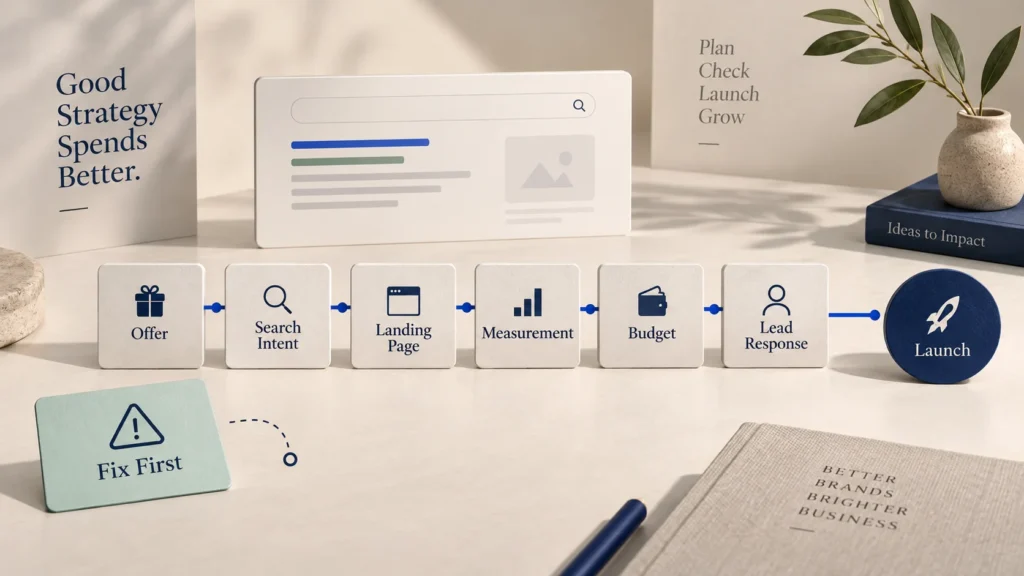

The monthly marketing report arrives with good news.
Impressions increased. The website received more clicks. Cost per click decreased. Several keywords moved upward. Social reach grew. The charts all point in the right direction.
Then someone asks a simple question:
Did this create any suitable customers?
The room becomes quiet because the marketing report ends at the form. Sales records begin in a spreadsheet. Phone calls are not consistently labelled. WhatsApp clicks are counted as conversions even when no message is sent. Nobody can connect a campaign to the final business result with confidence.
This does not mean clicks, impressions or rankings are useless. They are important diagnostic signals. They tell you whether people had an opportunity to see the business, whether they responded to the message and whether the website attracted attention. The mistake is asking those signals to prove something they cannot prove.
A click is not an enquiry. An enquiry is not automatically qualified. A qualified opportunity is not yet a customer. Each stage answers a different question.
This guide shows you how to measure the full journey—from visibility and visits to enquiries, qualification, customers and business value—without turning every report into a wall of numbers.
The short answer
Measure marketing in three connected layers:
- Attention: Did the right people have an opportunity to discover and visit you?
- Action: Did visitors take the meaningful next step the page was designed to support?
- Business outcome: Did those actions become qualified opportunities, customers, applications, purchases or another verified result?
The exact metrics depend on the business model, but a practical measurement system usually includes:
- impressions or relevant reach;
- clicks and click-through behaviour;
- visits or sessions to priority pages;
- meaningful website actions;
- completed enquiries or purchases;
- valid and qualified leads;
- response time;
- lead-to-customer rate;
- acquisition cost;
- revenue, margin, pipeline or an appropriate organisational outcome;
- reasons enquiries were invalid, lost or delayed.
Do not place every metric on the main dashboard. Choose a small set of outcome measures, then use supporting metrics when you need to diagnose why those outcomes changed.
One metric cannot explain the whole journey
Marketing is often reported as a funnel, but real customer journeys are not always linear. Someone may discover an article through search, return through a branded search, visit the company’s social profile, receive a recommendation and finally enquire directly. A single platform may receive credit according to its own attribution rules even though several interactions contributed.
That complexity does not make measurement pointless. It means measurement should be structured honestly.
Use this chain:
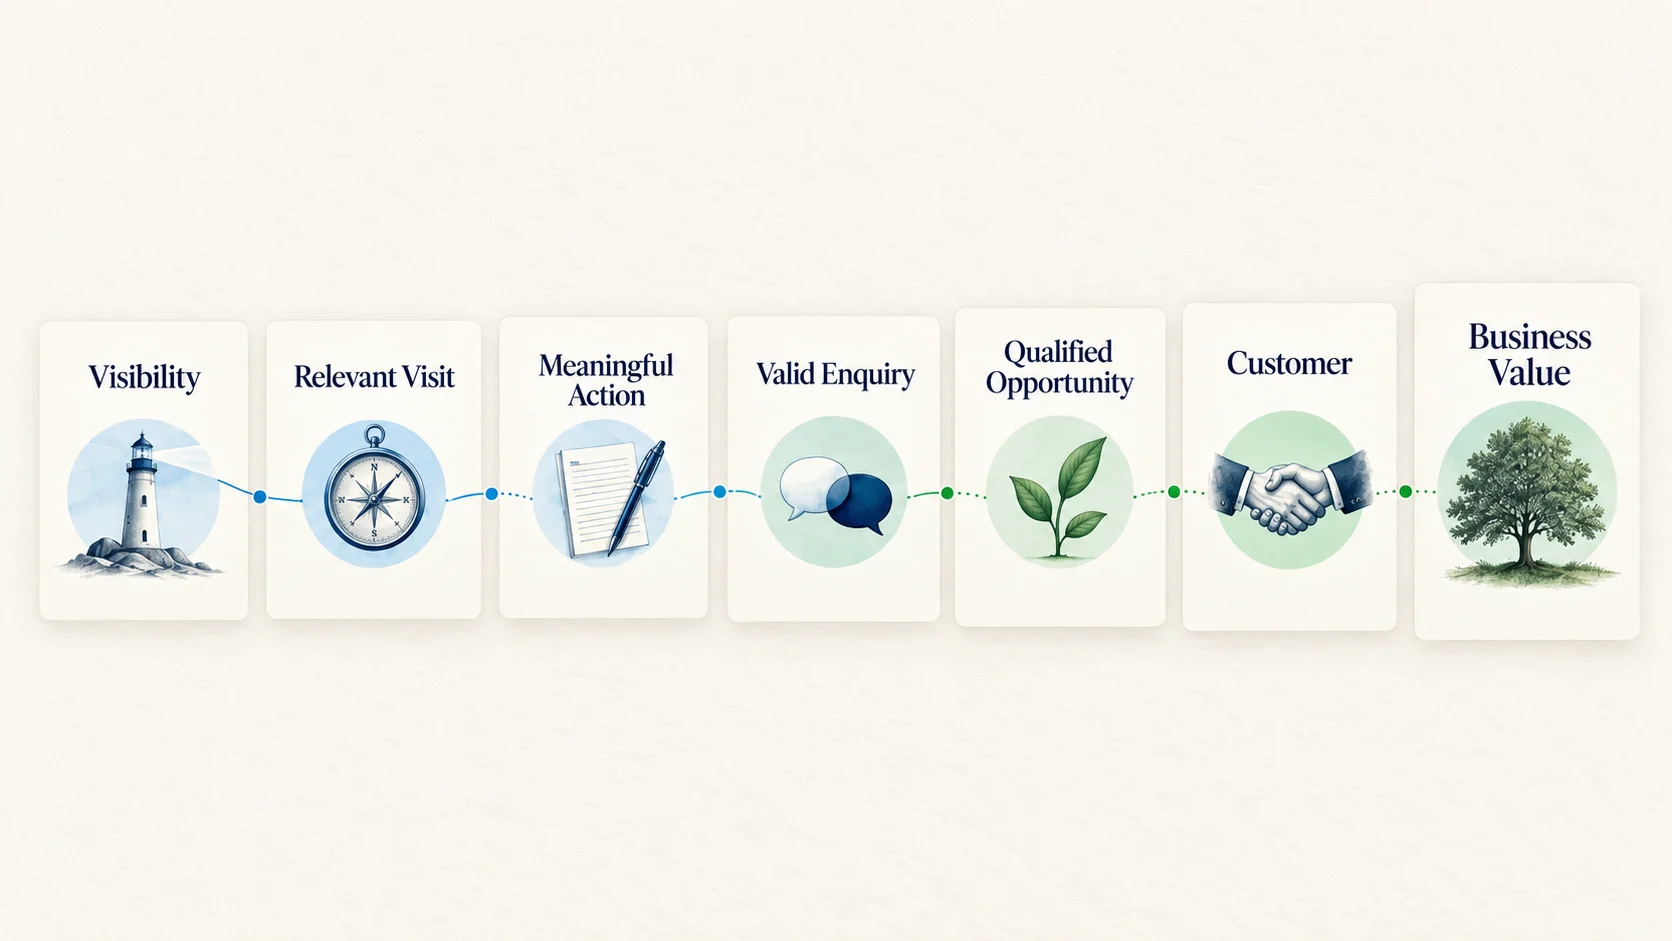
Visibility → Relevant visit → Meaningful action → Valid enquiry → Qualified opportunity → Customer → Business value
Every stage has a job.
| Stage | Main question | Example measures |
|---|---|---|
| Visibility | Were we present in relevant moments? | Search impressions, ad impressions, relevant reach |
| Visit | Did the message earn attention? | Clicks, sessions, landing-page visits, click-through rate |
| Action | Did the page help someone progress? | Form completion, verified call, booking, purchase, application |
| Validity | Was the action genuine and usable? | Valid enquiries, spam rate, duplicate rate, contactability |
| Qualification | Was the person, need and timing suitable? | Qualified leads, acceptance rate, sales conversations |
| Customer outcome | Did the opportunity become a result? | Customers, enrolments, purchases, completed bookings |
| Business value | Was the result commercially or organisationally useful? | Revenue, margin, pipeline, order value, retained value |
If the report jumps from clicks directly to revenue without reliable connections, it may overstate certainty. If it stops at clicks, it cannot show business value. A useful system connects the stages while clearly marking what is observed, attributed, inferred or still unknown.
Begin with the business decision
Before choosing metrics, decide what the business is trying to improve.
Different goals require different outcome measures:
- A service company may need qualified project enquiries.
- An ecommerce business may need profitable purchases and repeat customers.
- A university may need completed applications and confirmed enrolments.
- A local clinic may need booked appointments, subject to appropriate privacy and advertising requirements.
- A manufacturer may need sales-qualified opportunities for a defined capability.
- A publisher may need returning readers, subscriptions or member revenue.
- A nonprofit may need verified donations, registrations or volunteer applications.
“Increase website traffic” can be an intermediate objective, but it should explain why more suitable traffic matters. Without that connection, the business may double visits while receiving the same number of customers.
Write one measurement sentence
Use this format:
We will evaluate [marketing activity] by whether it helps [audience] complete [meaningful action], produces [qualified outcome] and contributes to [business value] within [appropriate decision period].
For example:
We will evaluate paid search by whether it helps operations teams request a workflow assessment, produces qualified consulting conversations and contributes to suitable proposals during the quarter.
This sentence keeps the dashboard connected to a decision.
Layer 1: Measure attention without mistaking it for success
Attention metrics describe visibility and response before a business outcome occurs. They are valuable because customers cannot act on an offer they never encounter. They become misleading only when presented as the final result.
Impressions
An impression generally indicates that content or an advertisement had an opportunity to appear under a platform’s counting rules. It does not prove that someone noticed, read or remembered it.
Use impressions to understand:
- whether visibility is expanding or declining;
- which searches, pages, audiences or locations create exposure;
- whether a campaign is eligible to enter relevant moments;
- how changes in demand or coverage may affect traffic;
- whether a priority topic is beginning to appear more often.
Do not compare impression counts from different platforms as if they use identical definitions.
Reach
Reach usually estimates or reports distinct people or accounts exposed to content within a platform. It helps explain distribution, especially in social and display environments. It still does not prove meaningful attention.
Use reach with frequency, engagement and downstream actions—not as a standalone claim of impact.
Clicks
A click shows that someone interacted with a link or advertisement according to the platform’s definition. It is stronger than an impression because the person acted, but it does not prove the visit loaded correctly, the visitor stayed or the need was commercially relevant.
Clicks help answer:
- Did the search result or advertisement attract interest?
- Which message or query earned a response?
- Which pages receive discovery traffic?
- Did a change affect traffic volume?
- Are irrelevant users consuming the budget?
The next step is to examine what happened after the click.
Click-through rate
Click-through rate is commonly calculated as:
Click-through rate = Clicks ÷ Impressions × 100
It helps compare how often an impression becomes a click within the same context. It should not be treated as a universal quality score. A highly specific advertisement may receive fewer clicks but better-qualified enquiries. A curiosity-driven headline may receive many clicks and disappoint visitors.
Use click-through rate to diagnose message-to-audience fit, then verify whether the resulting visits create meaningful outcomes.
Cost per click
Cost per click shows the advertising cost associated with clicks:
Cost per click = Advertising spend ÷ Clicks
A lower cost per click is not automatically better. Cheap clicks from irrelevant searches can be more expensive to the business than costlier clicks from genuine prospects.
Treat cost per click as an input cost, not a profitability measure.
Layer 2: Measure what visitors do after arriving
Website behaviour explains whether the destination supported the promise made before the click.
Users and sessions
Users estimate distinct visitors according to the analytics system’s identity and modelling rules. Sessions group interactions within a period of activity. One user may create several sessions, and privacy choices, browsers, devices and implementation can affect the counts.
Use users and sessions to understand traffic patterns, not to count unique human beings with perfect certainty.
Landing-page visits
The landing page is the first measured page in a visit. Reviewing landing pages helps connect acquisition with website experience.
Ask:
- Which pages attract organic or paid entry?
- Do those pages match the visitor’s likely intention?
- Which pages create meaningful actions?
- Which pages receive traffic but produce confusion or exits?
- Does mobile behaviour differ materially?
If traffic is increasing but enquiries remain weak, the diagnostic framework in Why Your Website Gets Visitors but Few Enquiries can help separate message, trust, usability, form and follow-up problems.
Engagement metrics
Engagement metrics can include engaged sessions, engagement time, scroll events, video activity or other platform-defined interactions. They help explain whether people used the page, but they are not universal proof of satisfaction.
A long time on a page could mean careful reading or difficulty finding an answer. A short visit could mean immediate disappointment or a fast successful phone call. Interpret behaviour in context.
Micro-conversions
Micro-conversions are smaller actions that may precede a main outcome:
- viewing a pricing or programme page;
- downloading a guide;
- starting a form;
- clicking a phone or WhatsApp link;
- adding a product to the cart;
- watching an important video;
- using a calculator;
- subscribing to updates.
These actions help diagnose progress. Do not automatically label them as leads or customers.
Key events and conversions
Google Analytics uses events to measure interactions. An event that is especially important to the business can be marked as a key event. Google’s current documentation also describes creating conversions from Analytics events for consistent measurement across Google Analytics and Google Ads where the feature is available.
The practical rule is simple: name the action in business language and decide what role it plays. A generate_lead event may represent a completed form, but the business still needs to verify whether the form created a genuine enquiry.
Layer 3: Measure the outcomes the business can verify
This is where many marketing reports become disconnected. Website tracking ends, and the business outcome continues in email, WhatsApp, phone calls, a CRM, an admissions system or an offline conversation.
Completed enquiries
A completed enquiry is an action received by the business through a defined channel. Examples include:
- submitted project form;
- verified phone call;
- sent and received WhatsApp message;
- booked consultation;
- completed application;
- product order;
- demo request.
The definition should exclude form starts, empty clicks and unsuccessful submissions.
Valid enquiries
A valid enquiry is genuine, contactable and related to something the business can consider.
Invalid enquiries may include:
- spam;
- duplicates;
- employment requests in a sales campaign;
- sales pitches from vendors;
- requests outside the service area;
- enquiries for services the business does not provide;
- false contact details;
- test submissions.
Track invalid reasons. A high invalid rate may indicate weak targeting, unclear page messaging or a technical spam problem.
Qualified enquiries
A qualified enquiry meets the business’s agreed criteria. Those criteria vary.
A service business might consider:
- problem and service fit;
- location;
- realistic scope;
- timing;
- decision authority;
- ability and willingness to invest;
- compliance or eligibility requirements.
An education provider might consider programme interest, eligibility, intake, location and completed next steps. An ecommerce business may not use lead qualification in the same way; it may focus on valid orders, payment, fulfilment and returns.
Write the qualification criteria before reporting the rate. Otherwise, different people will classify the same enquiry differently.
Opportunities
An opportunity is a qualified situation that has entered a real decision process: a discovery call, application review, proposal, demo, quotation or comparable stage.
This is useful in long-cycle businesses because customers may not close within the same month as the marketing activity.
Customers and completed outcomes
The customer or completed outcome is the verified result:
- paid customer;
- confirmed enrolment;
- completed booking;
- fulfilled purchase;
- signed agreement;
- accepted donation;
- another organisation-specific result.
The exact definition must be agreed with finance, sales, admissions or operations—not invented by the marketing team alone.
Revenue, margin and value
Revenue helps connect marketing to commercial outcomes, but revenue alone does not show profitability. Where possible, also consider gross margin, fulfilment cost, refunds, returns, discounts, payment failure and retention.
For long-cycle B2B marketing, pipeline value may help, but it must be labelled clearly. A proposal worth ₹10 lakh is not ₹10 lakh of earned revenue. Weighted pipeline is still an estimate, not cash received.
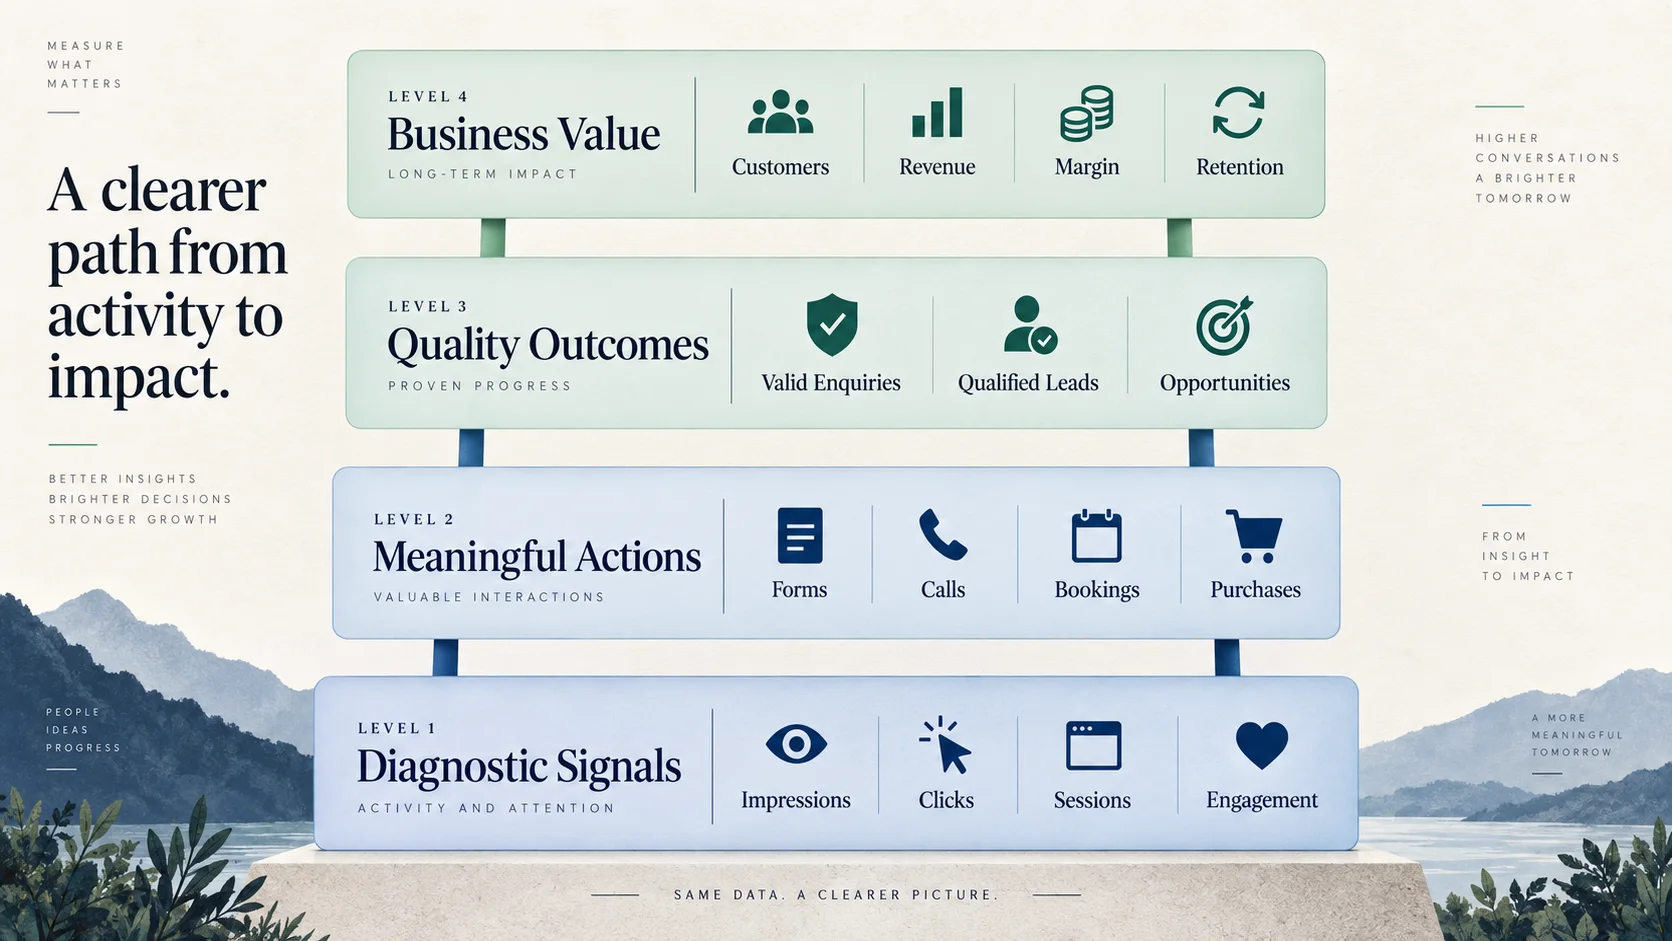
Build a measurement ladder
A measurement ladder prevents the business from treating every action as equally valuable.
Level 1: Diagnostic signals
- impressions;
- reach;
- clicks;
- click-through rate;
- cost per click;
- sessions;
- engagement;
- page views;
- form starts.
These explain attention and behaviour.
Level 2: Meaningful actions
- completed forms;
- verified calls;
- bookings;
- applications;
- purchases;
- confirmed messages.
These show that a person progressed.
Level 3: Quality outcomes
- valid enquiries;
- qualified leads;
- sales-accepted opportunities;
- completed applications;
- fulfilled orders.
These show fit and operational usefulness.
Level 4: Business value
- customers;
- enrolments;
- revenue;
- margin;
- retained customers;
- repeat orders;
- appropriate lifetime value;
- strategic value where defined.
These show whether marketing contributed to a result the organisation values.
Do not optimise the whole system toward a lower-level signal merely because it is easier to measure.
Use a shared vocabulary
Many reporting disagreements are definition disagreements.
One person calls every form submission a lead. Another calls only qualified enquiries leads. The advertising platform calls a WhatsApp click a conversion. Sales calls it nothing until a message arrives. Finance recognises value only when payment clears.
Create a measurement dictionary:
| Term | Exact definition | Data source | Owner | Exclusions |
|---|---|---|---|---|
| Click | A platform-recorded interaction with the selected link or ad | Search Console or advertising platform | Marketing | Invalid activity as handled by the platform |
| Enquiry | A completed contact action received by the business | Form, call or messaging system | Marketing/operations | Button clicks without completed contact |
| Valid enquiry | Genuine, contactable and within a possible service category | CRM or lead log | Enquiry owner | Spam, tests, duplicates, unrelated requests |
| Qualified lead | Valid enquiry meeting documented fit criteria | CRM | Sales/admissions | Valid but unsuitable enquiries |
| Opportunity | Qualified lead entering a defined decision stage | CRM | Sales/admissions | Early conversations without the required stage |
| Customer | Person or organisation completing the agreed commercial outcome | CRM/finance/commerce system | Sales/finance | Unpaid, cancelled or test records |
Add channel-specific definitions where needed. Keep them accessible beside the dashboard.
Measure SEO from discovery to business value
SEO reporting often stops at rankings or organic traffic. Those measures help explain discoverability, but the complete view connects search visibility with page usefulness and customer outcomes.
Search Console measures
Google Search Console’s performance reporting can provide:
- clicks from Google Search;
- impressions in search results;
- click-through rate;
- average position;
- queries;
- pages;
- countries;
- devices;
- dates and search appearance dimensions where available.
Use these measures to ask:
- Are priority pages gaining relevant visibility?
- Which queries reveal a mismatch between the page and searcher need?
- Are impressions rising without clicks because the result or intent is weak?
- Is one page receiving visibility for several conflicting intentions?
- Are branded and non-branded discovery changing differently?
Average position is a diagnostic average, not a fixed ranking observed identically by every user. Do not make one keyword position the whole SEO report.
Analytics measures for organic visits
Connect Search Console discovery with on-site outcomes:
- organic landing-page sessions;
- key events or conversions;
- completed enquiries;
- page journeys;
- device differences;
- new and returning usage where relevant;
- assisted or multi-touch contributions where the reporting method supports them.
CRM or business measures for organic leads
Add:
- valid organic enquiries;
- qualified organic leads;
- sales opportunities;
- customers;
- revenue or appropriate outcome;
- lead-quality reasons by landing page or topic.
This is how an article that produces few direct forms may still reveal value: it may introduce the business early, support later branded discovery or help a sales conversation. Be careful, however, not to claim influence that the available evidence cannot prove.
Measure paid advertising beyond the platform conversion
Paid advertising has clear cost data, which makes it tempting to calculate precise-looking performance from weak conversions.
Platform activity measures
- impressions;
- clicks;
- click-through rate;
- spend;
- cost per click;
- search terms or audience delivery;
- impression share or comparable eligibility measures where useful;
- conversion actions;
- conversion rate;
- cost per conversion.
Business-quality measures
- valid enquiries from the campaign;
- qualified enquiries;
- cost per qualified enquiry;
- opportunity rate;
- cost per opportunity;
- customers acquired;
- customer acquisition cost;
- revenue or margin attributable under the chosen method;
- time to conversion;
- invalid-lead reasons.
Use the right denominator
Several rates answer different questions:
Landing-page conversion rate = Completed primary actions ÷ Relevant visits × 100
Valid-enquiry rate = Valid enquiries ÷ Total recorded enquiries × 100
Qualification rate = Qualified enquiries ÷ Valid enquiries × 100
Lead-to-customer rate = Customers ÷ Qualified enquiries × 100
Cost per qualified enquiry = Campaign cost ÷ Qualified enquiries
Customer acquisition cost = Relevant acquisition cost ÷ Customers acquired
Document whether management, creative, landing-page and tool costs are included in acquisition cost. Two reports using different cost definitions should not be compared without adjustment.
Before launching a campaign, use What to Check Before Spending Money on Google Ads to verify the offer, destination, tracking, targeting, budget and response process.
Do not expect different platforms to report identical numbers
Google Ads, Google Analytics, Search Console, a CRM, a form plugin and a phone system may show different totals. A difference does not automatically mean one system is broken.
Possible reasons include:
- different attribution models;
- different conversion windows;
- click-date versus conversion-date reporting;
- identity and cross-device limitations;
- consent choices;
- ad blockers or browser restrictions;
- time-zone differences;
- processing delays;
- duplicate tags or missing events;
- imported versus native conversions;
- modelled data;
- spam filtering;
- different definitions of users, sessions, events or conversions;
- form records deleted or merged in the CRM.
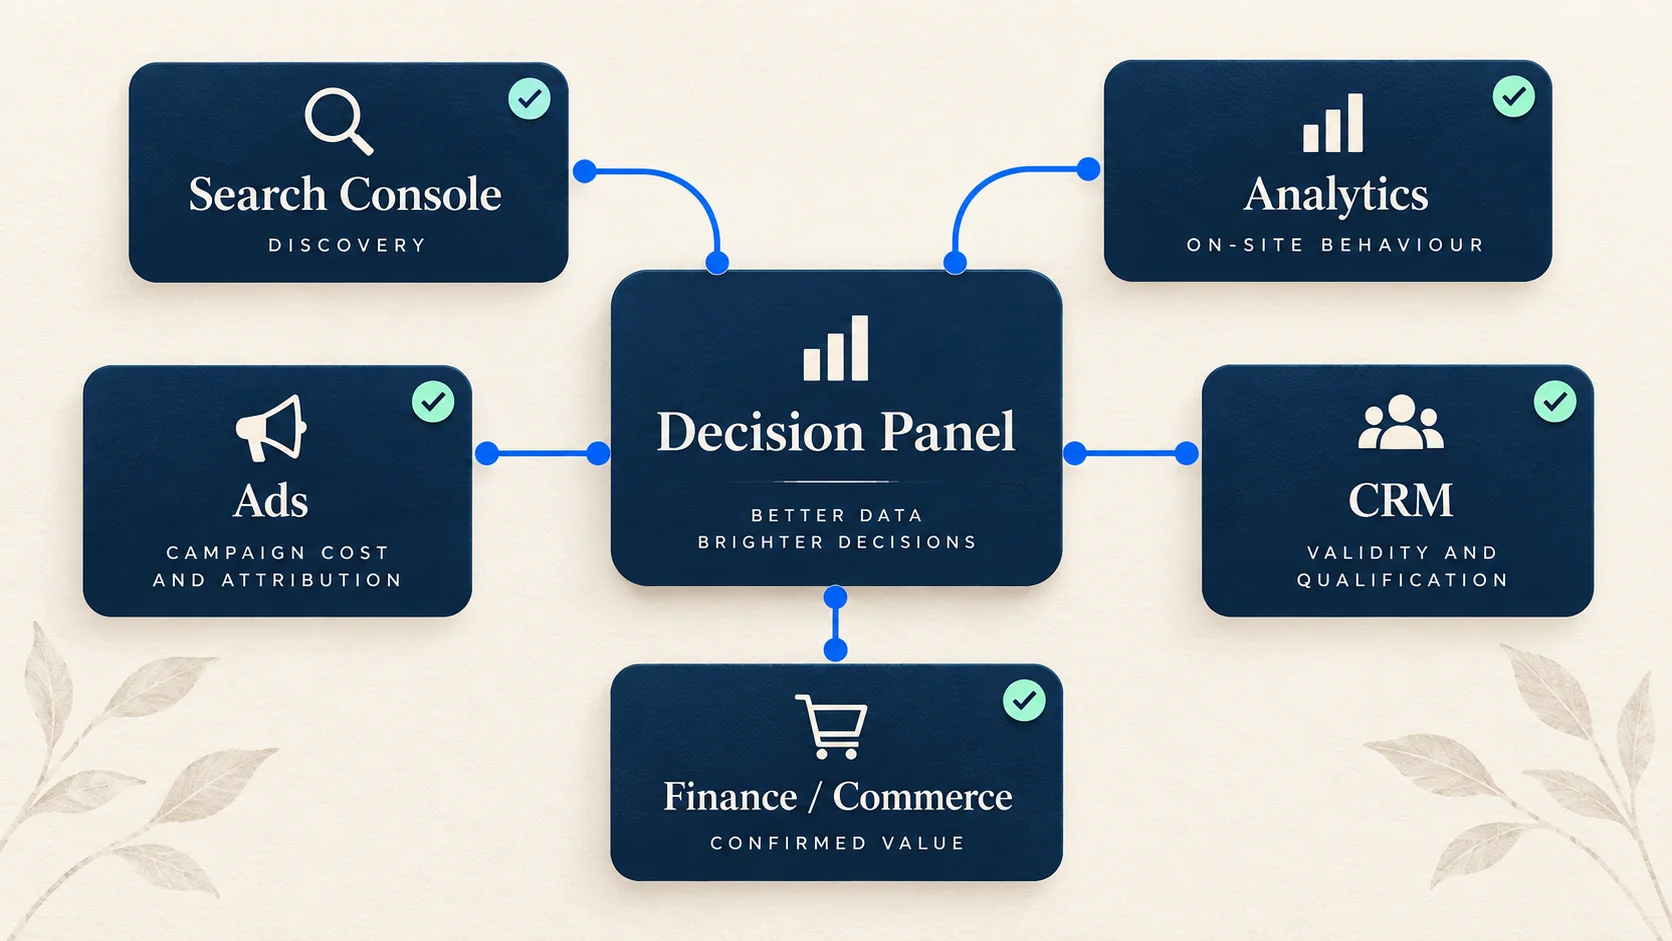
Reconcile; do not force equality
Create a reconciliation note:
| System | What it is trusted to report | Important limitation |
|---|---|---|
| Search Console | Google Search visibility and clicks under its reporting rules | Not a CRM and not a complete website-behaviour system |
| Google Analytics | On-site/app events, journeys and configured key events | Affected by implementation, consent, identity and attribution settings |
| Google Ads | Campaign delivery, cost and attributed conversions | Platform attribution is not the same as verified customer value |
| Website form system | Submitted form records | May include spam, tests and duplicates |
| CRM or lead log | Validity, qualification and sales stages | Depends on consistent human updates |
| Finance/commerce system | Confirmed payment, revenue, refunds and fulfilment | May not retain campaign detail without integration |
Assign a source of truth for each business question instead of asking one platform to answer everything.
Attribution is a decision model, not a perfect history
Attribution assigns credit to marketing interactions according to rules. It does not recreate every influence in a person’s mind.
A customer might:
- discover an article through organic search;
- later see a social post;
- receive a recommendation from a colleague;
- search the brand name;
- click an advertisement;
- call the business directly;
- become a customer several weeks later.
Which channel deserves credit? The answer depends on the model and the business question.
Use attribution carefully
- Use platform attribution to optimise activity within that platform.
- Use analytics to study connected digital journeys.
- Use CRM and customer evidence to verify business outcomes.
- Use customer interviews or “How did you hear about us?” as supporting context, not infallible truth.
- Label last-click, first-touch, data-driven or other methods accurately.
- Avoid adding attributed revenue from several platforms together; the same outcome may be credited more than once.
The goal is not to discover one unquestionable number. It is to make better decisions with known limitations.
Create a lead-quality feedback loop
Tracking ends too early when the marketing team receives only the number of forms.
Use a simple lead log with:
- lead ID;
- date;
- source and campaign where available;
- landing page;
- service or product interest;
- location;
- valid/invalid status;
- qualified/not-qualified status;
- next sales stage;
- reason lost or invalid;
- estimated or actual value where appropriate;
- final outcome;
- owner;
- response time.
Use consistent reason codes
Useful codes include:
- spam;
- duplicate;
- job seeker;
- vendor solicitation;
- wrong service;
- outside location;
- below minimum scope;
- no response;
- timing delayed;
- not eligible;
- chose another provider;
- price mismatch;
- qualified—decision pending;
- won.
Free-text notes add context, but standard codes make patterns measurable.
Return the learning to marketing
If many enquiries ask for a service the page does not provide, update targeting and page clarity. If qualified people hesitate over the same missing proof, strengthen the content. If one search theme produces many forms but few qualified leads, reduce emphasis or change the message.
Marketing data becomes more useful when customer-facing teams participate.
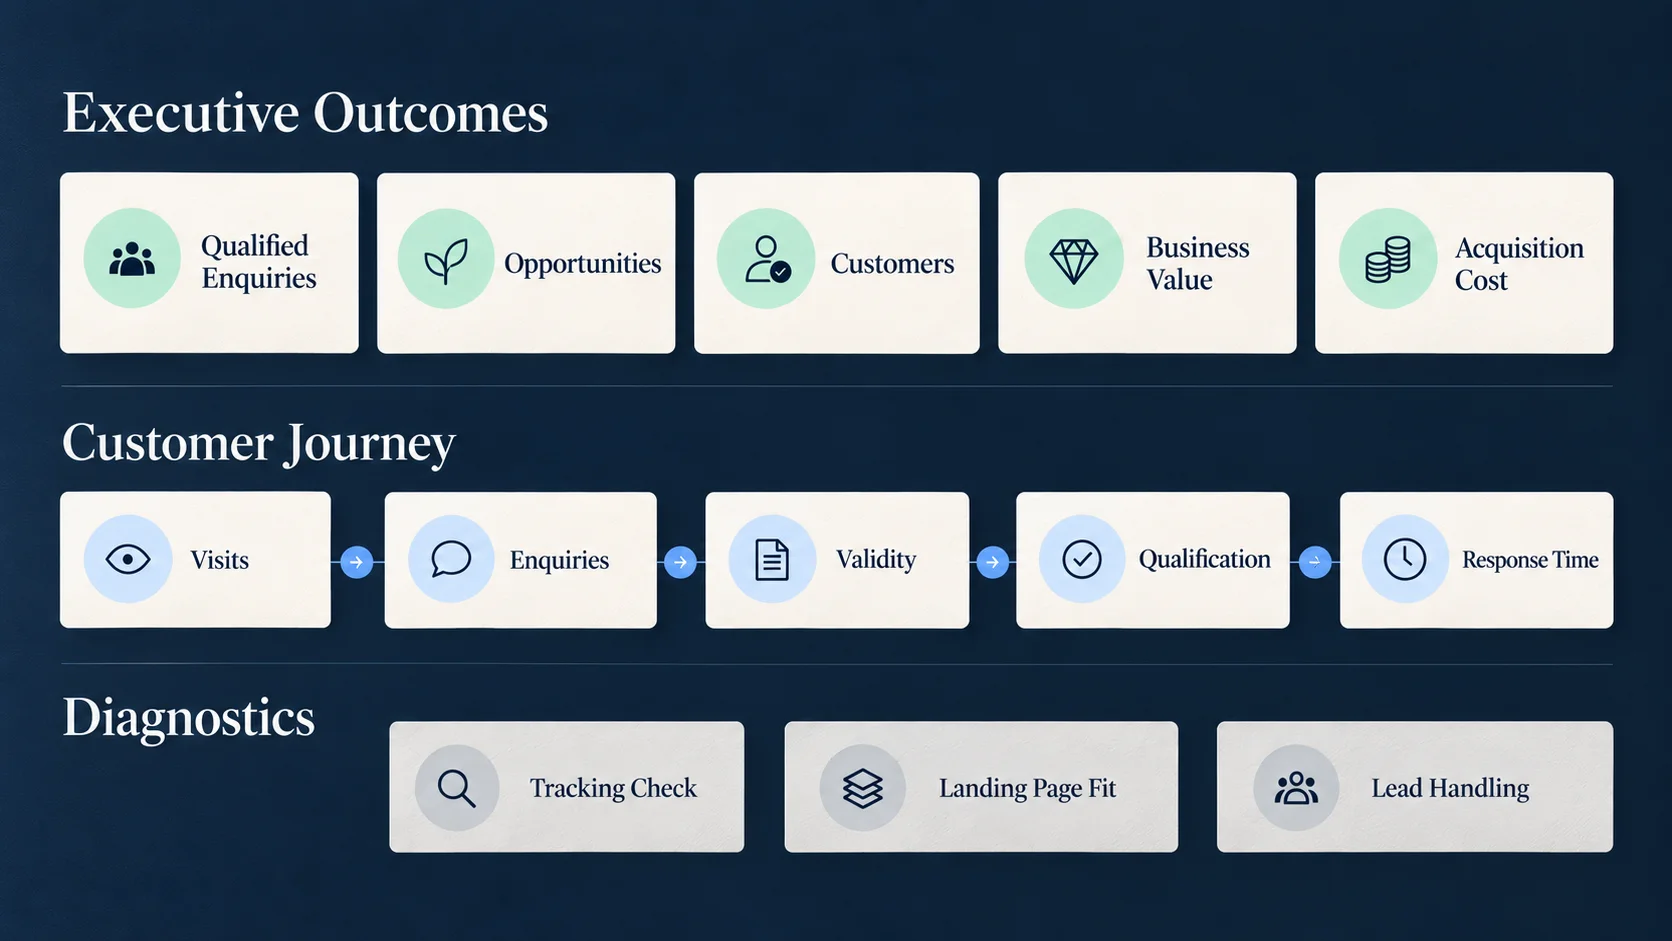
A practical measurement dashboard
The main dashboard should be small enough to understand in one conversation.
Executive outcome row
- Qualified enquiries or completed primary outcomes
- Opportunities created
- Customers or completed results
- Revenue, margin or appropriate value
- Acquisition cost at the agreed level
Journey row
- Relevant visits or clicks
- Completed enquiries
- Valid-enquiry rate
- Qualification rate
- Response time
Diagnostic section
Show only what explains a change:
- priority search visibility;
- campaign search terms;
- landing-page conversion rate;
- device or location problem;
- form error;
- spend pacing;
- lost-lead reasons;
- tracking-health warning.
Do not turn the main dashboard into a full platform export.
Add context to every number
For each metric include:
- current period;
- comparison period where appropriate;
- absolute number, not only percentage change;
- definition;
- source;
- annotation for major changes;
- data-quality warning;
- owner and next action.
A 100% increase from one lead to two leads is mathematically correct but easily misunderstood without the absolute numbers.
Use the right reporting rhythm
Different metrics need different review periods.
Daily or operational checks
- broken forms or checkout;
- tracking failure;
- campaign disapprovals;
- unusual spend;
- website downtime;
- obvious spam or irrelevant traffic;
- unassigned enquiries.
These protect the system. They are not a reason for daily strategy changes.
Weekly review
- spend and pacing;
- search terms and targeting quality;
- completed and valid enquiries;
- response time;
- page problems;
- early lead quality;
- changes made and pending tests.
Monthly review
- qualified enquiries;
- opportunities;
- customers;
- cost per qualified outcome;
- source and landing-page quality;
- lost reasons;
- SEO visibility and content trends;
- decisions for the next month.
Quarterly or longer-cycle review
- customer acquisition cost;
- revenue and margin;
- pipeline progression;
- retention or repeat value;
- channel contribution;
- seasonality;
- strategic investment balance;
- content and website priorities.
Match the review period to the decision cycle. A B2B campaign with a four-month sales process should not be judged solely on same-week revenue.
Four realistic examples
These examples are illustrative and contain no claimed performance benchmarks.
Example 1: A website-development agency
The agency reports 300 paid clicks and 18 form submissions. At first glance, the campaign appears to produce enquiries. The lead log reveals that seven submissions are job requests, four are vendor pitches, three are outside the service scope, two are valid but unsuitable, and two become qualified conversations.
The correct lesson is not simply that the campaign produced 18 leads. It produced 18 submissions, two qualified conversations and several clear reasons for wasted traffic.
Useful response: refine search themes and exclusions, state project fit more clearly, review form fields, keep measuring qualified conversations and avoid optimising to all submissions equally.
Example 2: A university admissions campaign
The campaign receives brochure downloads, WhatsApp clicks, completed enquiry forms and applications. The report combines all four as conversions.
That total cannot explain admissions progress.
Useful response: report brochure downloads and WhatsApp clicks as supporting actions, verified enquiries as a separate stage, completed applications as the primary outcome, and confirmed enrolments as the final organisational result. Track programme, intake and eligibility consistently while respecting privacy requirements.
Example 3: A local repair service
The campaign creates many calls. The platform reports call conversions, but the business does not record whether calls were answered or relevant.
Useful response: connect call records with answered status, duration as a diagnostic, service fit, location, booking and completed work. Review campaign schedules against staff availability.
Example 4: An SEO article library
Several articles attract impressions and organic clicks but few direct enquiries. Sales teams report that prospects frequently share those articles before requesting a proposal.
Useful response: examine assisted journeys, branded searches, article-to-service navigation and customer feedback. Add clear contextual next steps without turning educational pages into aggressive sales pages. Describe the evidence honestly: the articles appear to support consideration, but direct causation may not be fully measurable.
A 30-day measurement setup plan
Week 1: Define outcomes and ownership
- choose the primary business outcome;
- define enquiry, valid lead, qualified lead, opportunity and customer;
- assign a source of truth for every stage;
- document privacy and consent requirements;
- name the people responsible for data quality.
Week 2: Implement and test collection
- audit Analytics, Ads, Search Console, forms and CRM connections;
- remove duplicate or obsolete conversions;
- classify primary, secondary and diagnostic actions;
- test forms, calls, purchases or applications;
- confirm events appear once and reach the business system;
- document known measurement limitations.
Week 3: Build the lead-quality layer
- create lead IDs and source fields;
- add validity and qualification statuses;
- define loss and invalid reasons;
- brief sales, admissions or operations teams;
- test whether marketing can receive useful feedback.
Week 4: Build the dashboard and review process
- choose five executive outcomes;
- add journey measures and a limited diagnostic section;
- set daily, weekly and monthly review responsibilities;
- create a decision log;
- record a baseline;
- agree what evidence will trigger action.
The first dashboard will not be perfect. It should be understandable, auditable and useful enough to improve.
Data-quality checks before making decisions
Before changing strategy, ask:
- Did the website, form or checkout change?
- Did consent behaviour or tagging change?
- Are conversions firing once?
- Are test submissions excluded?
- Did the platform change a definition or interface?
- Are date ranges, time zones and currencies aligned?
- Is the comparison affected by seasonality, holidays or campaigns?
- Were leads classified consistently?
- Are refunds, cancellations or duplicate customers included?
- Is the sample large enough for the decision being proposed?
- Did sales response time change?
- Are several channels claiming the same customer?
Data quality is part of marketing performance. A beautiful dashboard built on duplicate events is not advanced measurement.
Common measurement mistakes
Reporting impressions as awareness proved
An impression shows an opportunity to appear, not verified memory or understanding.
Reporting clicks as leads
A click is an interaction. The visitor may leave immediately, fail to load the page or discover that the offer is irrelevant.
Reporting every form as a qualified enquiry
Submissions can include spam, duplicates, jobs, vendors and poor-fit requests. Add validity and qualification stages.
Counting button taps as completed conversations
A tap on phone, email or WhatsApp does not prove a call connected or a message was sent.
Celebrating lower cost per lead while quality declines
The system becomes cheaper at producing forms and more expensive at producing customers.
Combining paid and organic traffic without source detail
The total hides which investments and pages contributed to change.
Comparing platform totals without definitions
Different systems use different windows, models and identities. Explain the difference instead of silently selecting the preferred number.
Changing reports to make performance look better
Changing the conversion definition, attribution window or date range without annotation destroys trust.
Ignoring lost-lead reasons
The business knows leads are poor but cannot explain why, so targeting and messaging never improve.
Using rankings as the only SEO outcome
Visibility matters, but the page must attract relevant clicks, satisfy intent and help the business create value.
Demanding immediate revenue from a long decision cycle
The reporting window does not match how customers actually buy.
Building an enormous dashboard nobody uses
Measurement should support decisions. Remove metrics that never change a conversation or action.
Questions every monthly marketing review should answer
- What business outcome were we trying to create?
- How many meaningful actions occurred?
- How many were valid?
- How many were qualified?
- How many progressed to opportunities or customers?
- Which sources, searches and landing pages contributed?
- What did acquisition cost at each useful stage?
- Where did the largest drop occur?
- Why were leads invalid, lost or delayed?
- Did response time help or hurt?
- Is the tracking trustworthy?
- Which change created the observed movement?
- What remains unknown?
- What one action should the team take next?
- When will the effect of that action be reviewed?
If a report cannot answer these questions, it may be reporting activity rather than guiding the business.
Frequently asked questions
Which marketing metric matters most?
The most important metric is the verified outcome connected to the business goal—such as qualified enquiries, customers, purchases, applications or revenue. Supporting metrics explain how that outcome was created or lost.
Are clicks a useful metric?
Yes. Clicks reveal response to visibility and message. They are useful for diagnosing search results, advertisements and traffic sources. They should not be reported as enquiries or customers.
What is the difference between a conversion and a customer?
A conversion is a configured action recorded under a platform or analytics definition. It might be a form, call, purchase or smaller interaction. A customer is a verified business outcome. The two are identical only when the conversion action directly and accurately records the completed customer outcome.
What is a qualified lead?
A qualified lead is a valid enquiry meeting documented business criteria such as need, audience fit, geography, eligibility, scope, timing and ability to proceed. The criteria should be agreed before reporting.
Should WhatsApp clicks be counted as leads?
Treat them as interactions unless you can verify that a genuine, relevant conversation began. A click can be useful as a secondary action, but it does not prove a message was sent.
Why do Google Ads and Google Analytics show different conversions?
Differences can result from attribution models, conversion windows, click-date versus conversion-date reporting, consent, identity, imported versus native conversions, time zones, processing and implementation. Reconcile definitions and test tracking rather than assuming totals must match.
What should a small business dashboard contain?
Start with qualified enquiries or purchases, customers, business value, acquisition cost and response time. Add visits, completed enquiries, validity and qualification rates. Use detailed channel metrics only when diagnosing change.
How often should marketing performance be reviewed?
Check operational risks daily, campaign and lead quality weekly, business outcomes monthly, and customer economics over a period that fits the sales cycle. Avoid making major strategy changes from a few days of data.
How should SEO be measured?
Use Search Console to understand relevant visibility and clicks, analytics to understand landing-page behaviour and meaningful actions, and CRM or business records to verify lead quality and customer outcomes. Rankings alone are incomplete.
What if customer attribution is unclear?
Record what can be verified, use a consistent attribution model, review multi-touch evidence and ask customers for supporting context. Label uncertainty rather than forcing a precise claim.
Measure enough to make a better decision
The purpose of measurement is not to prove that marketing is busy. It is to help the business decide what to continue, improve, reduce or stop.
Impressions tell you about opportunity. Clicks tell you about response. Website actions tell you about progress. Enquiries tell you that someone reached out. Qualification tells you whether the contact fits. Customers and business value tell you whether the system produced a useful result.
Keep those stages connected, but do not collapse them into one number.
A trustworthy report should be able to say:
- what happened;
- where it happened;
- how it was measured;
- what business result followed;
- what remains uncertain;
- what the team will do next.
That is enough. Measurement does not need to make every journey perfectly visible. It needs to make the next decision clearer.
Receiving traffic and enquiries but still unsure what is creating business value? Build a clearer measurement system with Nothing Down. We will help connect your website, campaigns and lead process around the outcomes that matter.